Mike's Midweek Musings - Vol 4
Thoughts on the Salary Survey. Also, who wants an omelet?
Howdy friends,
It’s been a few weeks since we’ve done a midweek email. So many folks shared their thoughts about the Salary Survey and I wanted to respond. We got many things right and definitely could’ve done some things better. My insights are in the longer read below.
Thanks again to everyone who participated. I can’t tell you how much I appreciate it!
Here are a few other little tidbits to sweeten your coming holiday or make you chuckle a bit.
Four Things to Share This Week
Quick Hits:
How did you like the Salary Survey? A survey [10 sec]
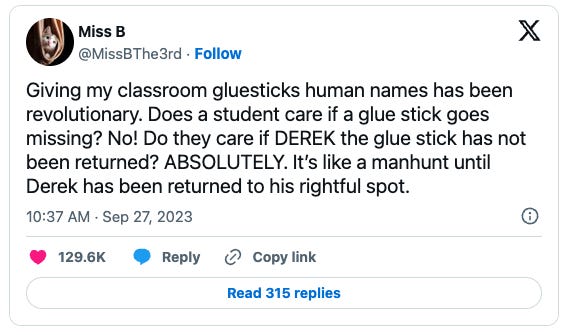
The name game 😂😂 [10 sec]
Enjoy yourself [6 min video]
A Longer Read:
So, about that survey [4 min]
#1 Show Me the Money!
A couple weeks ago, I sent out the salary survey. Let me know what you thought:
#2 This works for lots of stuff
#3 You’ve got time for breakfast during the break
How to Make a Potato Chip Omelet
You’re welcome.
The Longer Read (4 min)
#4 My insights after looking at the salary survey for, like, a hundred hours or something
By now, I hope everyone has had the chance to access the ‘23-24 Salary Survey that my team put together. I want to acknowledge at the outset that I had a lot of help with the final report. The portion related to affordability ratios was particularly time-consuming. A shoutout to my research assistant, who looked up the median home value of each zip code represented, is warranted. There is no centralized source for this information, so it was quite time-consuming. Thanks for all the help!
I wanted to break this reflection into three sections: 1. My Key Takeaways from the Survey, 2. Where We Could Improve, and 3. Ideas for the Future. I’ll try to keep this as straightforward as possible.
1. My Key Takeaways from the Survey
A. Honestly, we need more data …
I’ll discuss this more in section two below, but it bears disclosing upfront. Quite simply, we didn’t have enough data to make a compelling case for comparing different groups, which I think many people find most valuable. That said, I think we did have enough to get a decent snapshot of one demographic - public female administrators. I know that happens to be many of you, so that’s great!
B. Cost of Living is Key
I posted preliminary results on several popular administrators’ Facebook groups. I fully expected the response that I received.
“Hey! I’m a principal and I make $30K (less/more) than these numbers! What’s the deal?!”
It’s important to understand that salary is primarily driven by one factor - location. More specifically, you must factor in the cost of owning a home in an area to understand how far your paycheck will go. (I know that there’s a lot more to cost of living than real estate. In the future, we hope to include some non-housing items for a more accurate picture).
Let’s look at an example:
San Diego, CA
One of the highest principal salaries submitted was about $170,000 in the San Diego metro area. That’s 57% higher than the national average of our survey ($108,000). However, the current average home cost in San Diego is $956,000. That’s 148% higher than the national home value in our survey ($385,000).
That salary equals roughly $9,500 monthly (after taxes, social security, etc.). A 30-year fixed mortgage on a million-dollar home is about $5,500 per month, assuming 20% down and a lower-than-average interest rate. This is about 57% of your net income, leaving you about $4,000 in expendable dollars after housing costs.
Pittsburgh, PA
We received several submissions from the Pittsburgh metro area. One such respondent was 9% below our national average at $98,000. However, the average home price was almost 40% below the national average at $238,000.
That equates to about $6,100 net monthly income and a mortgage of $1,700 - just 28% of net income, leaving about $4,400 in expendable income after housing.
That doesn’t make these salaries the same, but it certainly doesn’t make them seem as far apart when compared in simple dollar amounts.
Note: If you’re wondering how I got my gross vs. net pay figures, check out ADP’s paycheck calculator and Smart Asset’s state income tax calculator.
C. Gender pay gaps are hard to nail down … without more data
Many of you requested that I include gender information in the survey - and I’m glad I did. I think it’s a really helpful demographic category to analyze, and I appreciate the suggestion. And while I did hear back from several folks that they felt women were paid less than men, this was highly variable depending on many factors.
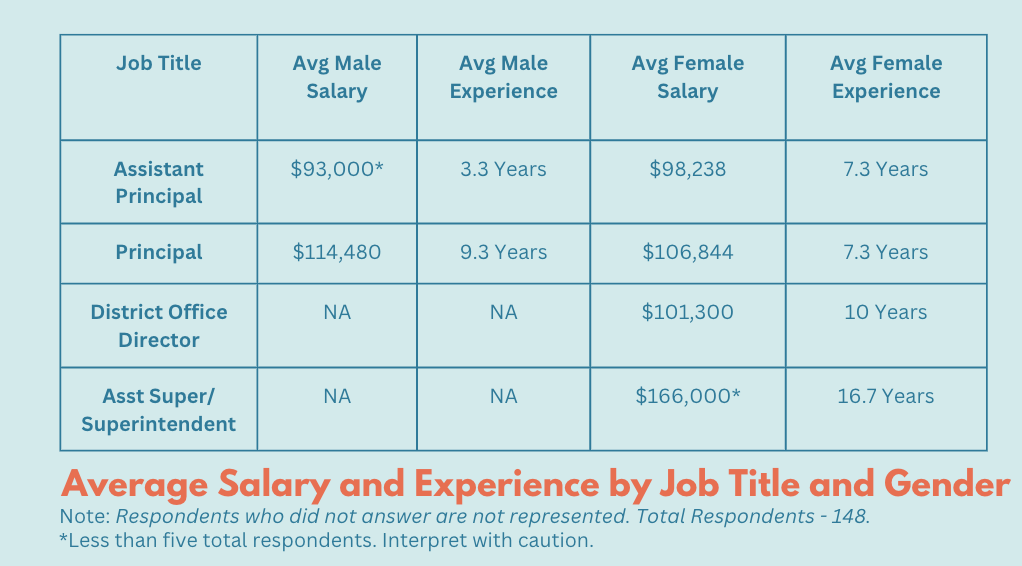
At the simplest level, many pay disparities could be attributed more to years of experience than gender. For instance, in the table above, you’ll notice that male assistant principals made less than their female counterparts, and the reverse is true of principals. But again, in both cases, years of experience tracked more closely with salary than gender.
However, one area where this theory seemed to fall apart was looking at salary by size of district enrollment.
In the table above, you’ll notice that male salaries outpaced female salaries in nearly every category. This could indeed indicate some level of disparity. The unfortunate limiting factor is, again, a lack of data. You’ll notice an asterisk next to many data points, indicating that we received less than five total respondents for these categories - frequently only one or two. This calls into serious question the validity of the averages for both males and females when applied at a national level.
This brings me to our next section …
2. Where We Could Improve
A. Broken record time: “We need more data.”
I’m saying it over and over because it’s true. There may indeed be a gender pay gap in several areas, but without good comparative data, it’ll be impossible to know for sure. That’s why we need more respondents - specifically for the following:
male administrators at all levels (including district office)
both male and female assistant principals
both male and female private school administrators
both male and female administrators from every part of every state
Basically, we need more of everyone!
Now, my subscriber audience is about 80% female, which I love! So, it’s no surprise that we received more female respondents than male, but that still leaves over 1,500 male subscribers. I’m hopeful if we send the form out once more, we’ll get a great second-round response.
Note: If we resend the form and you have already completed it, you won’t need to do it again. We will simply add to our current data.
B. Improve the affordability ratio
As I stated previously, we’d love to improve the affordability ratio to include more than just real estate prices. For example, taxes vary significantly by state. My salary as an administrator in Oregon was above average, but was almost completely offset by my high state income tax bracket. Factoring this comparison into our affordability ratio when comparing with no tax states like Texas or Tennessee could be helpful. Additionally, other factors like the cost of food and child care in different locations could be great.
As it happens, we gained (completely lawful) access to a data set from the Economic Policy Institute that will allow us to include all of these factors into a new affordability ratio. The hope is that this, combined with more data, will make for a much more robust, updated report.
C. Include Full Remuneration
We definitely learned a lot about what questions to ask and how to ask them. We included questions on retirement benefits, union status, professional learning allowances, and other details.
We learned that we went about this in two fundamentally flawed ways:
We asked open-ended questions
We made it anonymous
Now, normally it’s good to ask open-ended questions. But if you’re trying to get a good set of comparable data, it makes much of it difficult to compare. Especially if you have zero way of contacting respondents to ask clarifying questions.
I think we’ll likely table this ambitious section of the survey until ‘24-25, but we plan to revive it. I think it has the potential to yield some very helpful information. And I think we can do this while maintaining anonymity, we simply need to learn to ask better questions.
3. Ideas for the Future
A. More Surveys?
I’ll be honest. Working through survey results and developing a method of presentation is a LOT of work. But it’s also a lot of fun. And I’m hopeful that you find it beneficial.
I’ve wanted to produce more surveys for quite some time. I think anonymous surveys can be very helpful in supporting administrators across the country. For instance, I’d love to conduct an Administrator Morale survey. Imagine if you could learn the drivers of deep satisfaction and dissatisfaction from colleagues across the country (and globe) who bear the same burden as you. I think the anonymous component of this makes it very accessible for most folks, and the insights could be extraordinary.
B. Tips on Negotiating
I read recently that more than half of administrators in a particular state do not have a pay schedule. Instead, they negotiate their starting salary.
Since all future increases, retirement, and other factors are typically a percentage of your salary, this makes your negotiating skills the most important factor in your lifetime earning potential, second possibly to your local cost of living.
Now, I’m no Jedi when it comes to negotiating. However, I am a recovering accountant and did take advanced negotiations in business school. Also, I’m confident I could convince a school district HR director to give me anonymous tips to share on salary negotiation. Let me know if that would be useful to you.
Note: If you ARE an HR director who would be willing to chat off the record, reply to this message! I’d love to chat:)
Thanks for processing with me. Hang in there, folks! We’re almost to some fun family time.
Cheers,
Mike


